Analytics dashboard
The platform provides a comprehensive data analytics and visualization panel that monitors key operational metrics such as API call volume, response time and error rate in real time.
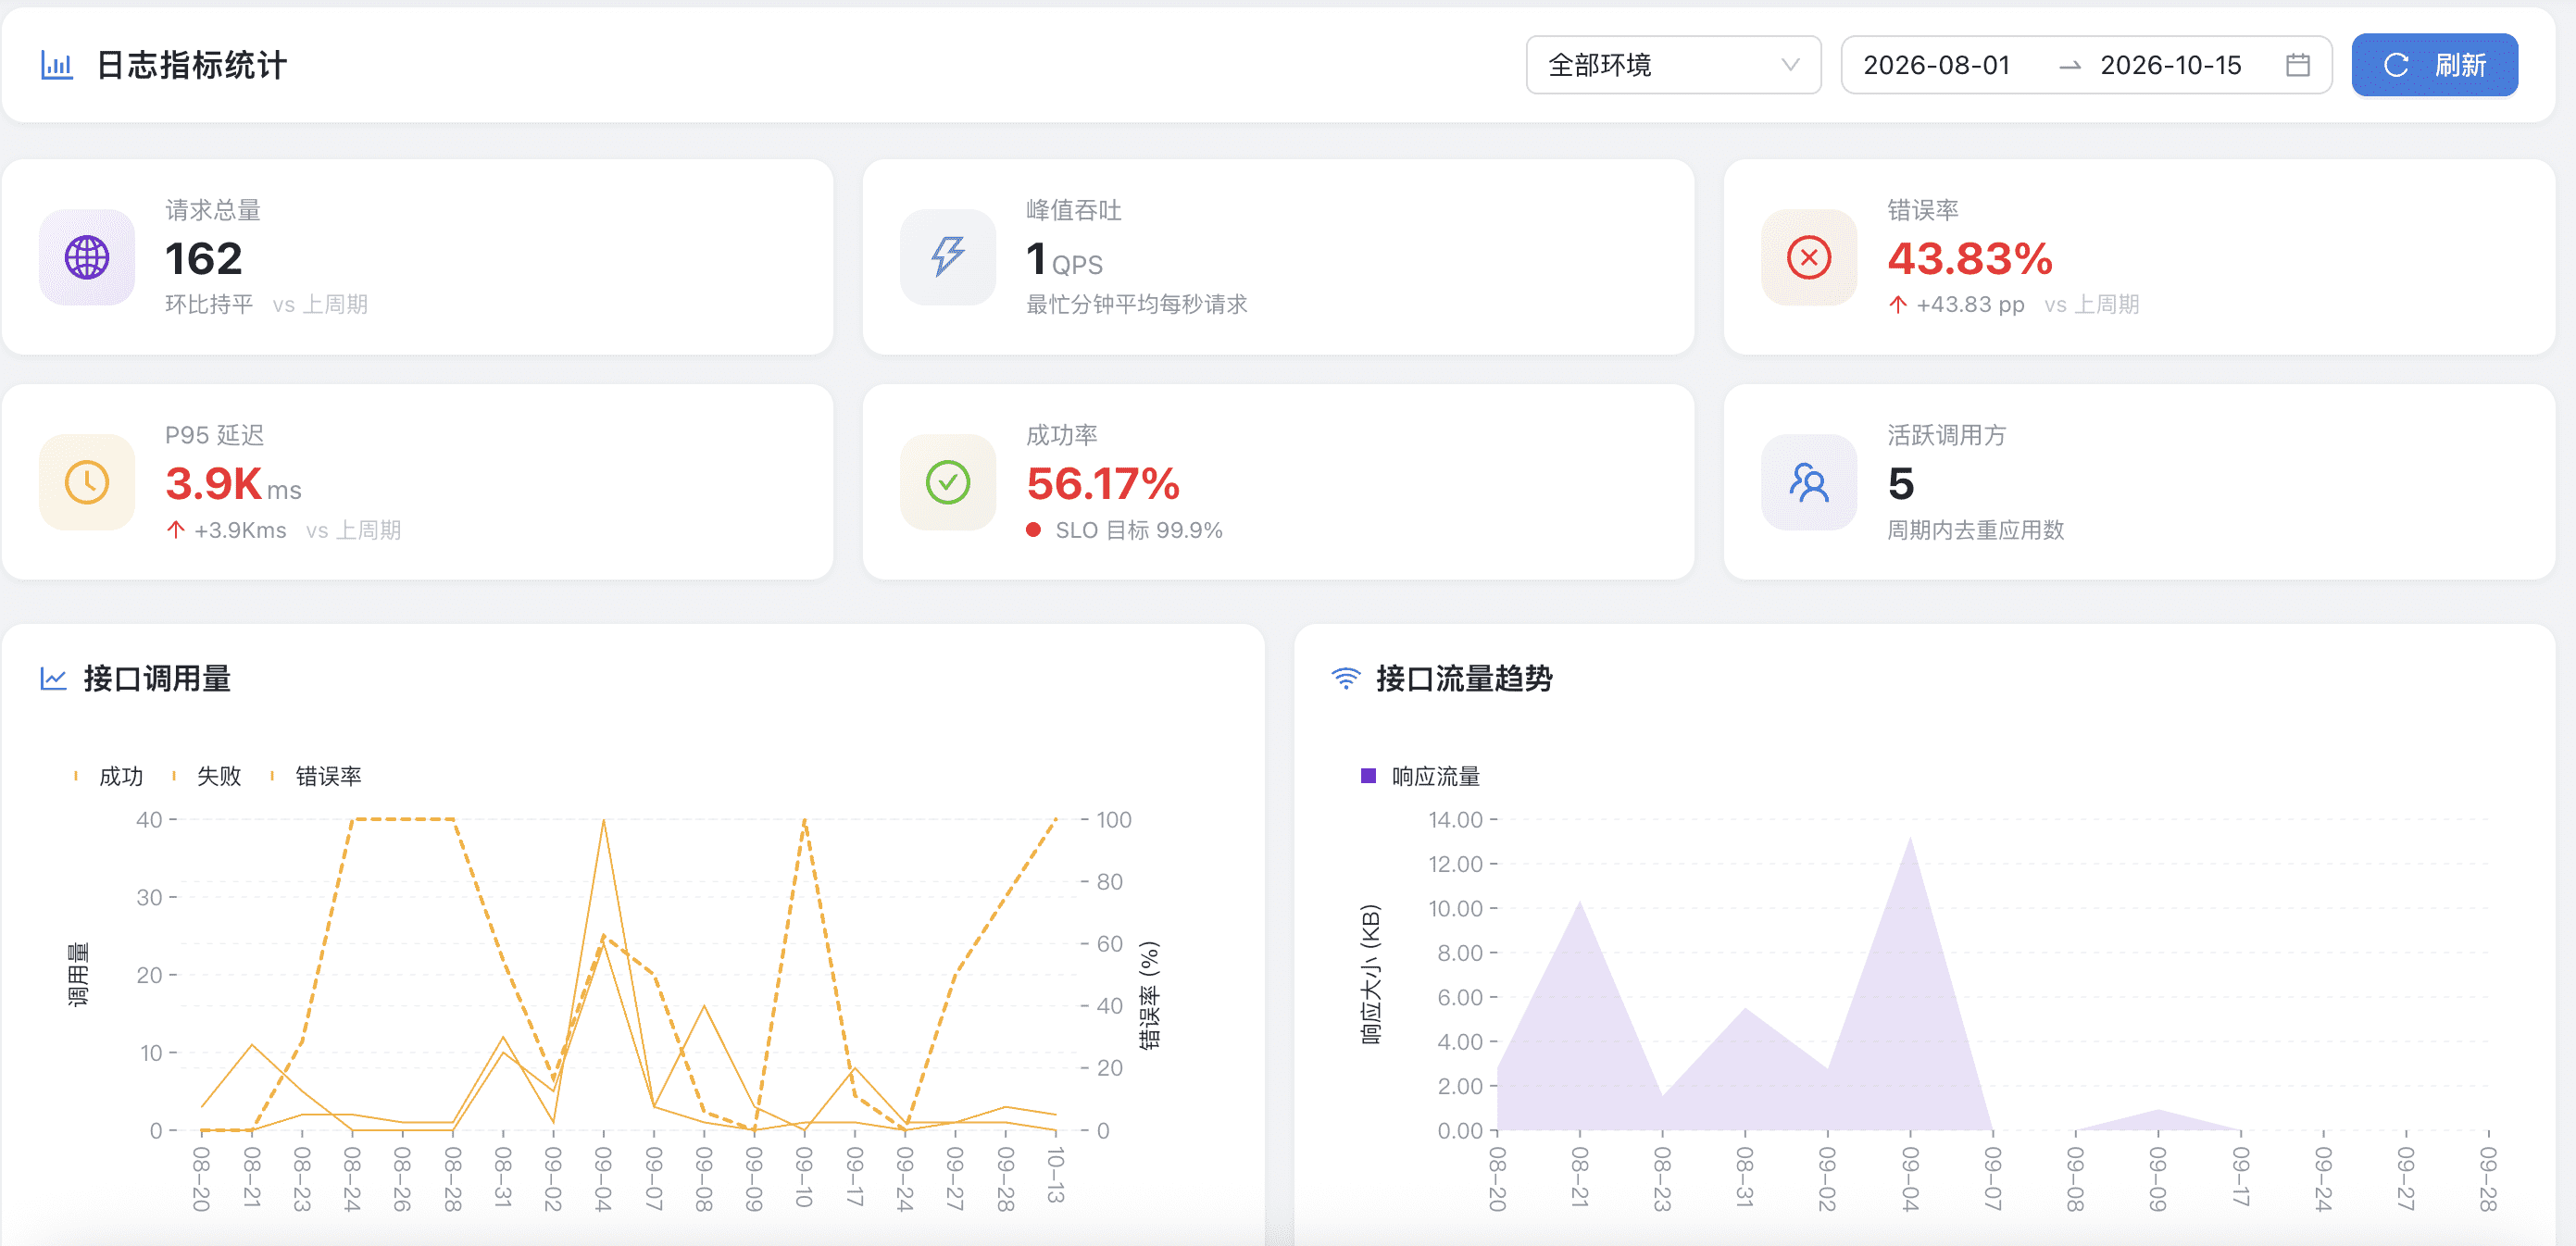
Core metrics
| Metric | Description |
|---|---|
| Request volume | Call volume statistics and traffic trends over time |
| Average latency | Average API response time, with slow request tracing |
| Error rate | HTTP status code distribution and the proportion of abnormal requests |
| Success rate | Overall call success monitoring |
Multi-dimensional rankings
- Popular API ranking: top APIs by call volume
- Slow API ranking: APIs with the highest average latency, to identify performance bottlenecks
- App call ranking: activity statistics by calling app
- Top IP statistics: source IP activity and visitor analysis
- Data source activity ranking: access popularity by data source / schema / table
Call logs
Every API call records a complete log:
- Request parameters, response result, latency and status code
- Calling app, source IP and the end-to-end traceId identifier
- Storage supports MySQL (default) or Elasticsearch (large-scale scenarios)
Logs support paginated search and filtering for troubleshooting and auditing.
Alert integration
Combined with alert rules, you can:
- Automatically detect timeouts / abnormal status codes / error rate over threshold / consecutive failures
- Send multi-channel notifications via email, SMS and Webhook
- Query alert trigger records with pagination